A quick warning that this discussion will be just a little bit technical and would benefit from at least some basic familiarity with numerical weather prediction models. A great resource to find out what the models are and how they are similar and different is the COMET MetEd operational models matrix: http://www.meted.ucar.edu/nwp/pcu2/index.htm. And another opening factor to point out is the overall difficulty in predicting heavy rainfall: precipitation forecasting has been called "the poorest performance area of forecast systems worldwide" (Fritsch and Carbone 2004, Bulletin of the American Meteorological Society). So keeping this in mind, let's begin...
Medium-range forecasts
There were plenty of indications of a rainy week in Colorado (and much of the western US), several days in advance. One illustration of this is the 7-day precipitation forecast issued by the NOAA Weather Prediction Center on Monday morning, September 9, for the period through the following Monday, the 16th. (Note that this is a forecast made by human forecasters, using the numerical models as well as their knowledge of meteorology, etc.) |
| Fig. 1: WPC 7-day precipitation forecast, issued 6 am Monday 9 September, for the period through 6 am Monday 16 September. |
When forecasters consider the medium range (beyond, say, 2 or 3 days into the future), they use ensemble forecasts -- a series of forecasts that use slightly different initial conditions, or slightly different model configurations. Ensembles can provide some information about the range of possible weather outcomes, and can increase or reduce confidence depending on how much agreement there is among the members of the ensemble. The medium-range ensemble that is generally considered the best in the world is that from the European Centre for Medium Range Weather Forecasts (ECMWF). However, the ECMWF charges a *lot* of money to access their forecasts in real-time, so most US forecasters couldn't have actually seen the EC ensemble prior to this event. Researchers can access it after the fact, though, and we'll use the forecast from Monday Sept. 9 here as a sort of benchmark for the medium-range forecasts.
 |
| Fig. 2: ECMWF ensemble precipitation forecasts initialized at 1200 UTC (6 am) Monday 9 September, for the 7-day period from then through 1200 UTC Monday 16 September. The left panel shows the probability of exceeding 50 mm (about 2 inches) of rain, the middle panel 100 mm (4 inches), and the right panel 150 mm (6 inches). Purple contours show the probabilities at 4%, 10%, and every 10% above that. Probabilities above 50% are colored. The thick dashed black line indicates the ensemble mean, and the green contour indicates the observed precipitation at that threshold. ECMWF forecasts were obtained from the TIGGE portal at http://tigge-portal.ecmwf.int |
Let's also consider the US version of a medium range ensemble, known as the Global Ensemble Forecast System (GEFS).
 |
| Fig. 3: As in Fig. 2, except for the US Global Ensemble Forecast System. |
1-2 days ahead
Typically, as you get closer in time to the weather system you're trying to predict, you can narrow things down, being more specific about (in the case of rainfall), where, when, and how much. This is true of both the numerical models and the human forecasters. Here, we'll focus only on the models going forward, and perhaps will revisit the human forecasts later on.In my opinion, the key forecasts in this event were those issued on Wednesday Sept. 11 -- good forecasts at this lead time could provide adequate time for preparations in advance of the predicted heavy rains on 12th and 13th. However, rather than narrowing in on a specific outcome for this event, the models showed a fair amount of disagreement. Some were pointing to extremely heavy rainfall, whereas others had more modest amounts. Let's look at the forecasts from a bunch of different models from 0000 UTC 11 September (6 pm Tuesday evening).
 |
| Fig. 4: 12--36-h precipitation forecasts from models initialized at 0000 UTC 11 September (6 pm MDT 10 September) and valid for the period from 1200 UTC (6 am) 11 Sept. to 1200 UTC (6 am) 12 Sept. Models are (top row, left to right) GFS, NAM, short-range ensemble (SREF) bias-corrected mean, and ECMWF; (second row, left to right) CSU 12-km WRF members 1-4; (third row, left to right) CSU 12-km WRF member 5, CSU 12-km WRF mean, CSU 4-km WRF, and NAM 4-km nest). Bottom left corner shows the NOAA Stage IV precipitation analysis, used here as the "truth". Note: you may want to right-click and "view image" to see the full-size versions of these figures. |
 |
| Fig. 5: As in Fig. 4, except for the 12--60 hour forecasts covering the period from 1200 UTC 11 Sept (Weds morning) to 1200 UTC 13 Sept (Friday morning). Note that the color scale is different. |
Here at CSU, we run several WRF model configurations at 12-km horizontal grid spacing over the western US. These runs aren't done on a supercomputer, but on modest desktop machines! However, they rely on the NCEP models like the NAM and GFS for their initial conditions. (More details on these runs can be found here: http://schumacher.atmos.colostate.edu/weather/csuwrf_info.php) Anyway, it turns out that a couple of these runs---particularly members 2 and 3---were predicting a lot of rain for northern Colorado. Member 2 had a maximum amount for this 48-hour period of over 10", which ended up being very close to what was observed. Interestingly, member 2 is initialized from the GFS, and member 3 from the NAM -- they didn't even share the same initial conditions. In hindsight, a "blend" of members 2 and 3 would've been an outstanding precipitation forecast, though the other members of the CSU ensemble did not perform nearly as well. Still, these runs seemed to have a stronger signal of the extreme rains to come than several of the other models did. I'd like to think that there's something special about the configuration of our runs, but we don't have a good sense yet for whether they got the forecast right for the right reasons or were somehow "lucky". We plan to look more closely into this.
Often in the modeling world, it's expected that increasing the resolution of the model (i.e., decreasing the grid spacing) will give better results. And often this is indeed the case -- the more realistically you can represent the atmosphere in the model, the more realistic your forecast should be! But sometimes it doesn't turn out that way, and at least from this preliminary look that appears to be the case here. (There are past research papers on cases where higher resolution actually hurt the forecast.)
The two runs that might currently be considered "high resolution" on Fig. 4 above are the 4-km CSU WRF (which is run on a larger computer cluster; info at http://schumacher.atmos.colostate.edu/weather/csuwrf_info_4km.php) and the 4-km NAM nest (the 3rd and 4th entries in the 3rd row.) The CSU run did produce some extreme rainfall amounts -- over 6" -- but this was out over the eastern Plains. The atmospheric processes that produce heavy rainfall on the Plains are often distinct from those that affect the mountains, so even though this forecast showed large accumulations over the Plains, a forecaster likely wouldn't translate that to mean a potential for extreme rainfall in the mountains. The NAM 4-km nest precipitation forecast looks broadly similar to its coarser-resolution parent model. These comparisons aren't exactly apples-to-apples, but at least this preliminary picture shows that a couple of the coarser-resolution runs performed better than their higher-resolution counterparts. More research will be needed to see if this is a robust result by configuring the model in exactly the same way, except for the grid spacing.
Thus, the model forecasts from 0000 UTC 11 September painted an uncertain picture regarding the potential for extreme rainfall in Colorado -- it appeared possible (and thus warranted close attention), but perhaps not all that likely. Considering that extreme rainfall is rare in September in this area, it's not unreasonable that a forecaster might discount the "high-end" members of an ensemble in this case; that's essentially what I was thinking on Wednesday as well.
We don't run our CSU ensemble at 1200 UTC (again, because these runs are being done on computers that people need for other things during the day!), but we can look at the other models initialized at that time, and also valid at 6 am Thursday.
 |
| Fig. 6: As in Fig. 5, except for models initialized at 1200 UTC (6 am) Sept. 11 for the 0--48-hour forecast. CSU forecasts are not run for the 1200 UTC cycle, thus they are blank here. |
So then, the heavy rains fell on Wednesday night and Thursday morning, initiating the devastating floods in many of the rivers and streams along the Front Range. However, there was still rain falling, and the chance of more heavy rain on Thursday and Friday that could make the flooding even worse. For these rains on Thursday into Friday morning, the numerical models appear to have performed quite a bit better:
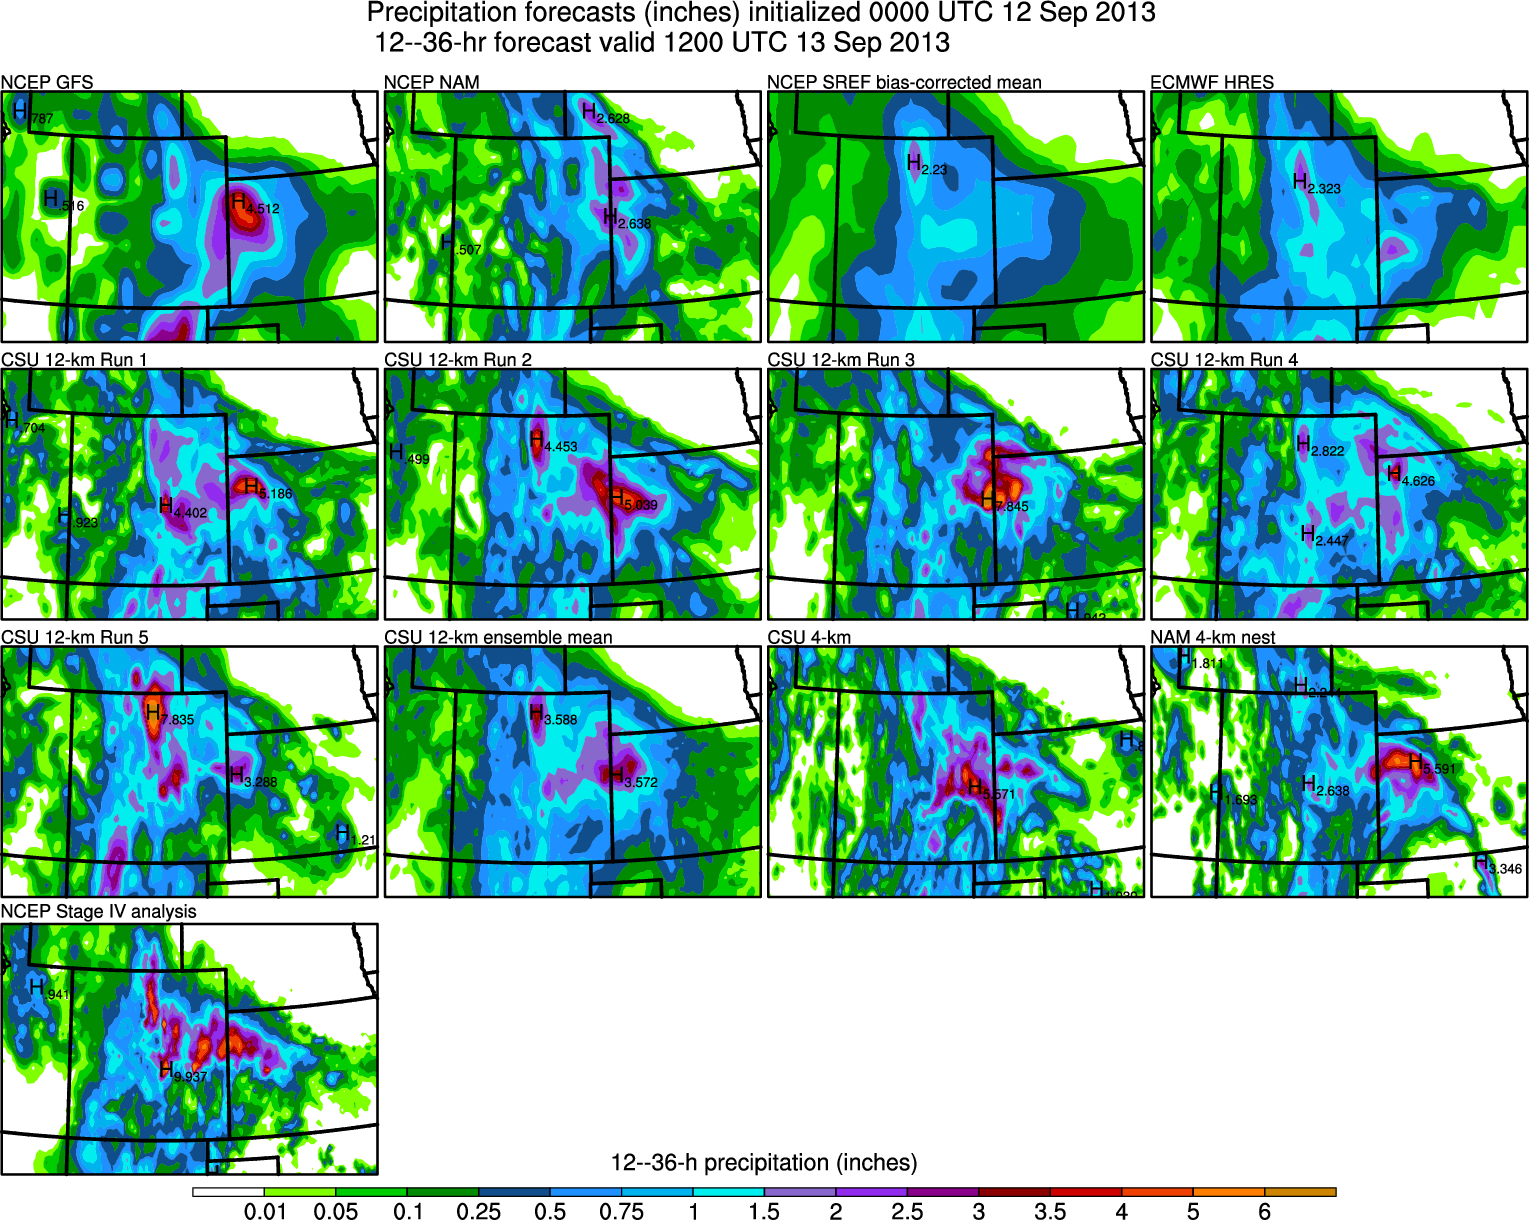 |
| Fig. 7: As in Fig. 4, except for models initialized at 0000 UTC Sept. 12 for the 12--36-hr forecasts for the period ending at 1200 UTC (6 am) Friday Sept 13. |
Short range
One numerical prediction system that has revolutionized short-term (i.e., from 0-15 hours) forecasting is the High Resolution Rapid Refresh (HRRR), developed at NOAA's labs in Boulder. It has 3-km horizontal grid spacing, covers most of the US, and runs every hour out to a 15-hour forecast. However, this also means there are lots of forecasts to look at and try to interpret. A couple of the HRRR forecasts illustrated the short-term potential for very heavy rain in Boulder County---the 2300 UTC run showed two swaths with more than 3" of rain over the upcoming 12-h period---but the runs immediately after that moved the heavy precipitation out of Boulder County. |
| Fig. 8: Animation showing 7 HRRR precipitation forecasts valid at 1200 UTC 12 September. The first was initialized at 2100 UTC 11 September, and the last at 0300 UTC 12 September. Note that the precipitation accumulation period is not the same for all of the runs, but all cover the primary period of heavy rainfall in the night of 11 Sept. and early morning of 12 Sept. Obtained from the HRRR website at: http://ruc.noaa.gov/hrrr |
No comments:
Post a Comment